


Overall Analysis
Oil continues its momentum towards downside with swing creation indicating selling opportunities.
Natural Gas trying to break selling trend, but 0.5 feb retracement gives strong reject.
Oil Chart Analysis
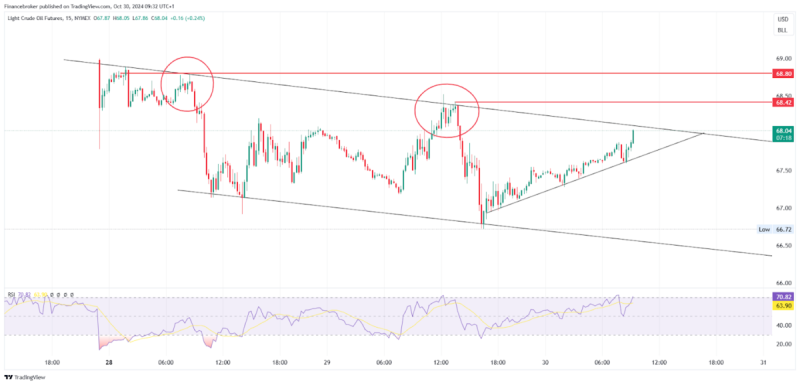
Oil/USD 15-Minute Chart (Source: TradingView)
On the 29th Oct 2024 oil price showed high volatile behavior, price is currently following a channel based moment. Where price can be seen rejecting the resistance trendline, overall the market is in the selling zone.
Currently if we look at the price which is taking a trendline support to move upwards, in this strong build up can be seen, breaking of resistance trendline will not instantly trigger buy position.
If we look at the historic data, when price takes rejection from resistance trendline it falls sharply towards supporting trendline.
For a potential entry, one should plan to hold the trade long-term. If the price rejects the resistance trendline, consider a selling entry with a target at the support trendline and a stop loss set at the 68.42 level.
Natural Gas Chart Analysis
Gas/USD 15-Minute Chart (Source: TradingView)
On 29th Oct 2024 price showed a volatile behavior, where after opening price showed a selling behavior and broke previous day low, creating a double bottom pattern. On the same the price went up and broke the patterns neckline and achieved target but with high volatility.
As we can see natural gas faced huge selling on 28th Oct 2024 and when price went up to respect the double bottom pattern, 0.5 level of Fib retracement gave healthy rejection taking the price in sideways direction.
If planning for an entry than there are few setup which one can follow to create position. Please note due to high volatility one be trap of stop loss hunting
If prices successfully breaks fib retracement 0.5 level, than wait for price to break 2.9512 level and close above it for the target of 3.0020 with the stop loss of 2.2915
If price breaks the golden ration of 0.6 and falls than wait for price to break 2.8740 level and make position ones price closes below the level for the targets of 2.8470 and 2.8150 with stop loss of 2.9030
The post Oil & Gas Trends: Resistance Rejections & Trade Setups appeared first on FinanceBrokerage.