


Overall Analysis
Bitcoin tries to break the previous day’s high of $68759 but fails and closes negative.
Ethereum opened sideways and continued directionless moments in the last hours, showing a rally towards the upside.
Bitcoin Chart Analysis
BTC/USD 15-Minute Chart (Source: TradingView)
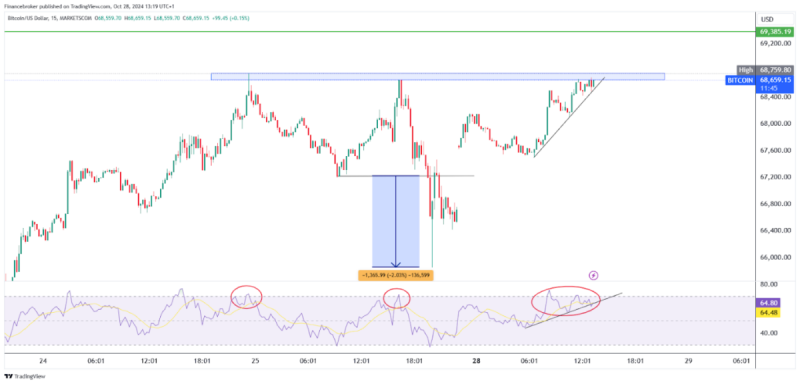
On October 25th, Bitcoin (BTC) broke the previous day’s high of $68,759 within 15 minutes but faced a major rejection at this level, forming a double-top pattern on the chart. Later that day, the price broke the neckline of this pattern, delivering returns of up to 2%. On a larger time frame, such as the daily chart, we can observe that the price is currently moving within a channel and attempting to break higher levels.
Analyzing the RSI, we see that Bitcoin faced rejection due to an overbought scenario, as the price moved upward too quickly without consolidation. This led to a price reversal at that level.
Currently, the price is pausing at higher levels, with the RSI providing support. If the price breaks through the current resistance, buyers can enter with a target of $69,385 and a strict stop loss of $68,350.
However, if the price once again faces rejection at higher levels, it could form a triple top pattern, which presents a potential trading opportunity with a small stop loss and higher profit targets.
Ethereum Chart Analysis
ETH/USD 15-Minute Chart (Source: TradingView)
On October 27th, Ethereum continued to display sideways momentum, creating opportunities for scalping trades only. On a larger time frame (daily chart), Ethereum is trading in a tight range, which means even small swings on smaller time frames are driving the RSI into overbought territory.
The current level shows limited room for upward movement, as $2,556 acts as a major rejection level. A retest of the supporting trendline could trigger a buying opportunity. If the price holds the support, traders can enter with a target of $2,556 and place a stop loss below the recent swing low.
If the second largest crypto continues to make higher highs and higher lows, breaking the $2,556 level could provide a safer entry, with a stop loss below the swing low and targets at $2,585 and $2,621.
Option sellers can also take advantage of the sideways market by selling 2700 CE and 2300 PE options.
The post BTC and ETH: Technical Analysis of Recent Price Action appeared first on FinanceBrokerage.